Prometheus is a great metrics monitoring system and works particularly well with Go where a web application is usually a single process behind nginx.
With Python and gunicorn it gets quite complicated as there are several instances of the same web app. If you use gunicorn and follow the default instructions on integrating the Python client for Prometheus you will end up with useless metrics as gunicorn will load balance the /metrics endpoint between each gunicorn worker.
(Clone this repo if you want to try these examples)
Let’s see how this works with a simple Flask app and Prometheus listening on a separate port.
# Start two instances of the naive app with one and four workers
docker-compose -f compose-naive.yml -d up

# Send 100 requests to the app with one worker
docker run --rm --net prometheusgunicorn_default williamyeh/boom -n 100 -c 10 http://naive_app:9010
# ...

# Check the request counter in /metrics
docker run --net prometheusgunicorn_default -it --rm clue/httpie naive_app:9011/metrics  | grep request_processing_seconds_count
# request_processing_seconds_count 100.0

# Send 100 requests to the app with four workers
docker run --rm --net prometheusgunicorn_default williamyeh/boom -n 100 -c 10 http://naive_app_w4:9010
# ...

# Check the request counter in /metrics
docker run --net prometheusgunicorn_default -it --rm clue/httpie naive_app_w4:9011/metrics  | grep request_processing_seconds_count
# request_processing_seconds_count 20.0
As you can see the Prometheus HTTP server captured only a portion of counters for the app with four workers because the app started several times and the Prometheus server only started once as it tried to bind to the same port each time.
Consul
This issue was solved by defining a range of ports that can be used when trying to start the metrics server. As each gunicorn worker starts it loops over this range of ports and continues onto the next one if there is an error (i.e. it is already used by another worker). Every metrics server registers with Consul so that it can be easily discovered by Prometheus.
docker-compose -f compose-clever.yml -d up

# Send some requests to clever app
docker run --rm --net prometheusgunicorn_default williamyeh/boom -n 100 -c 10 http://clever_app:9010
This Docker Compose configuration also starts a Prometheus instance and forwards port 9090 from your machine. Here you can see that every worker registered as a separate service under the same job name.
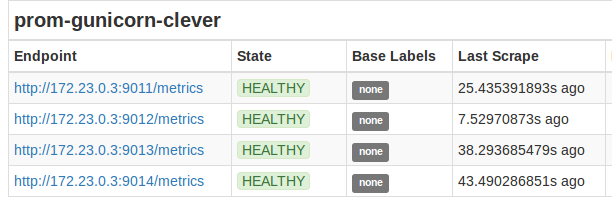
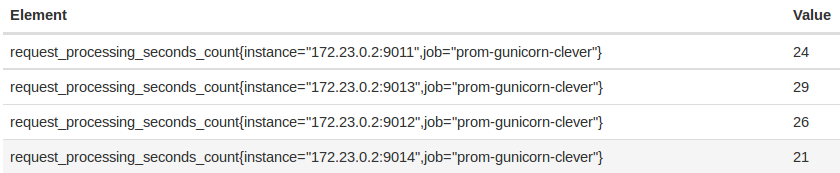
We can now query Prometheus for HTTP request counts by instance or use sum(request_processing_seconds_count) by (job) to get a single time series which sums request counts from all workers.
The best way to start using this in your application is to copy this module and use it like this:
from prometheus_multi import start_prometheus_server
start_prometheus_server("your-service-name", port_range=(9011, 9020))